context
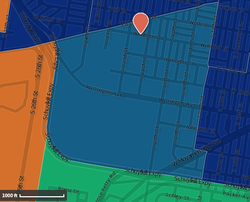
This data comes from Social Explorer, a website that organizes census data into color coded maps. Tract 38, the tract in which GAMP is situated, varies in size slightly over the decades, but GAMP remains within the same tract throughout. The tract, pictured on right (in light blue) is bordered to the north by Passyunk Avenue and to the East by 18th st. The West and South boundaries are demarkated by the Schuylkill Expressway. The pink pin marks 2136 W Ritner St, GAMP's location.
Racial composition (in terms of concentration of white population)
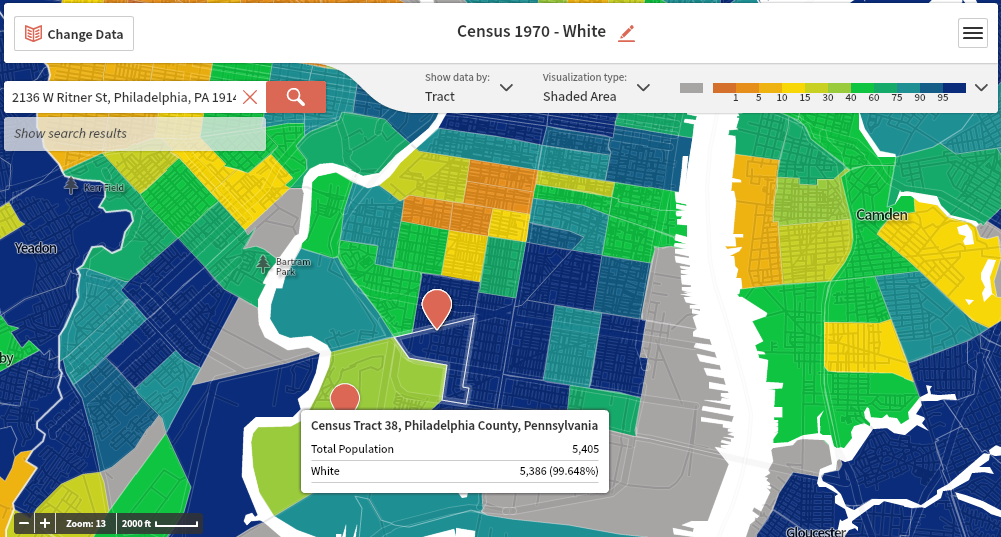
Tract 38, Total Population in 1970: 5,405. White Population: 5,386 or 99.648%.
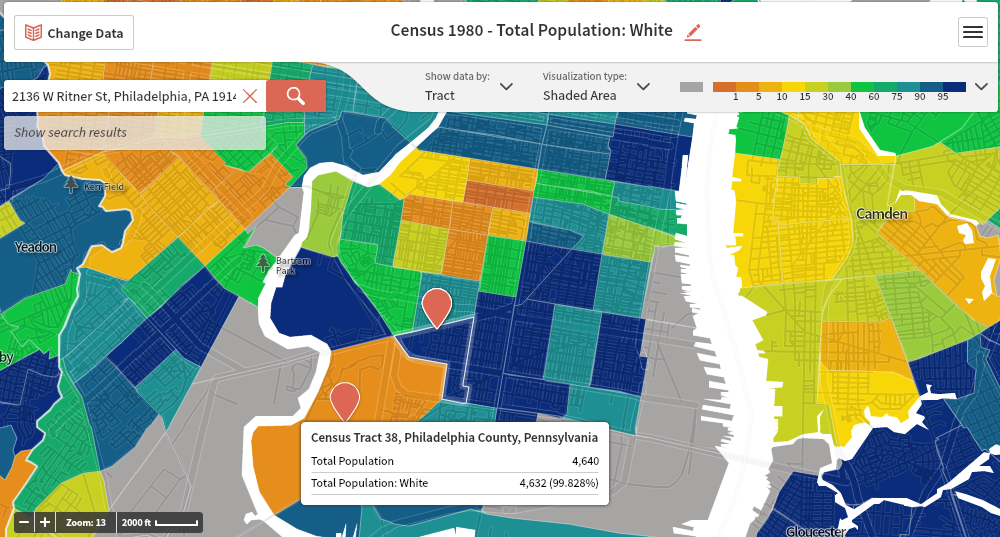
Tract 38, Total Population in 1980: 4,640. White Population: 4632 or 99.828%.
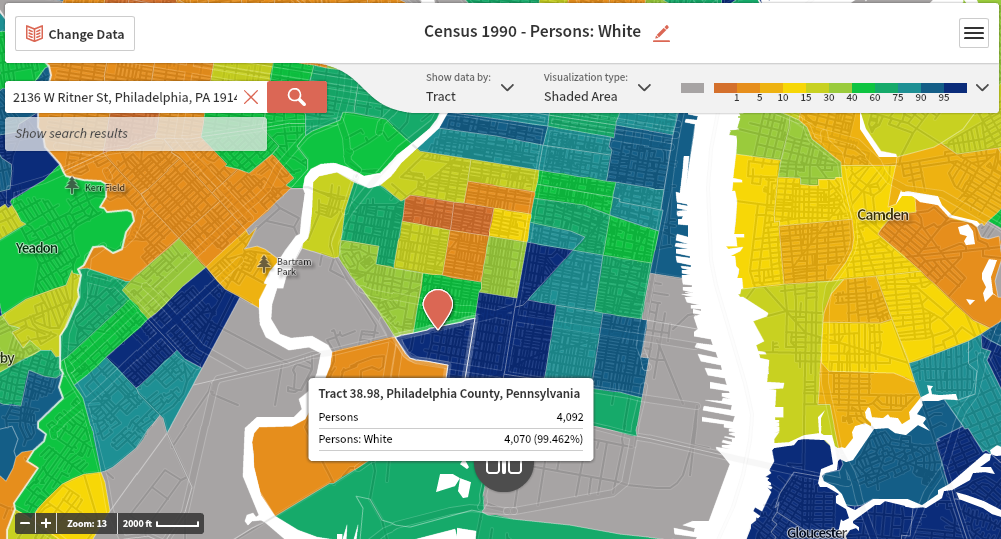
Tract 38.98, Total Population in 1990: 4,092. White Population: 4,070 or 99.462%.
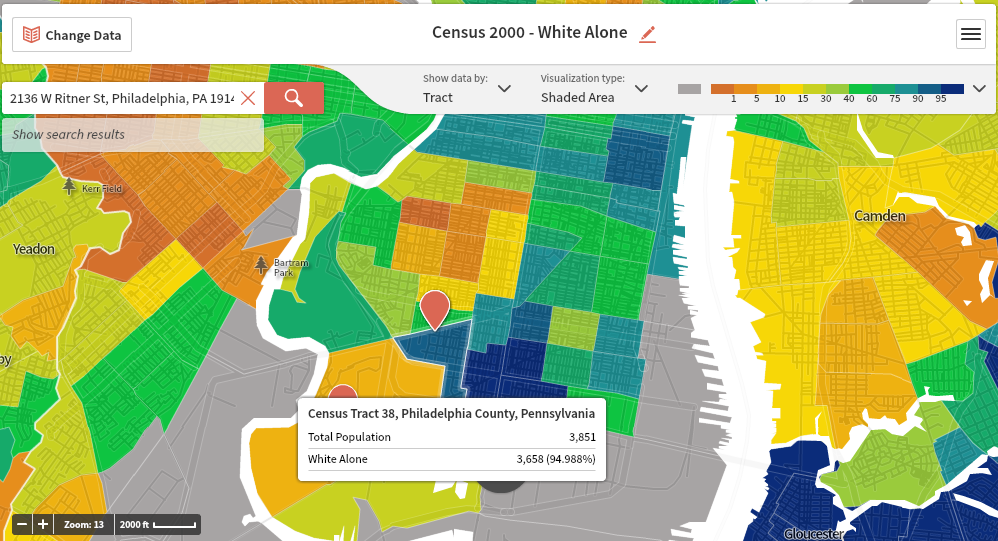
Tract 38, Total Population in 2000: 3,851. White Population: 3,658 or 94.988%.
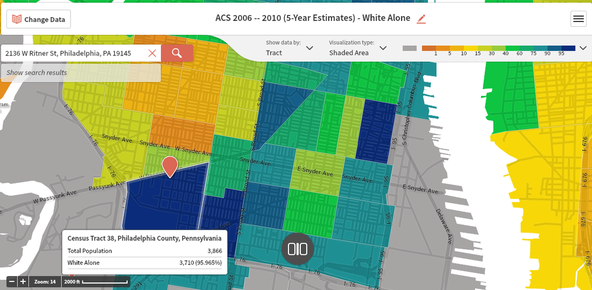
Tract 38, Total Population in 2010: 3866. White Population: 3,710 or 95.965%.
While Tract 38 remains over 95% white from 1970-2010, the neighborhoods around it are less constant. The tracts east of Tract 38 show a downward trend in concentration of White Population from 1970 to 2010. The tracts to its north, in contrast, remain relatively constant with higher populations of POC which, according to other images on Social Explorer, are primarily composed of Black populations.
income data
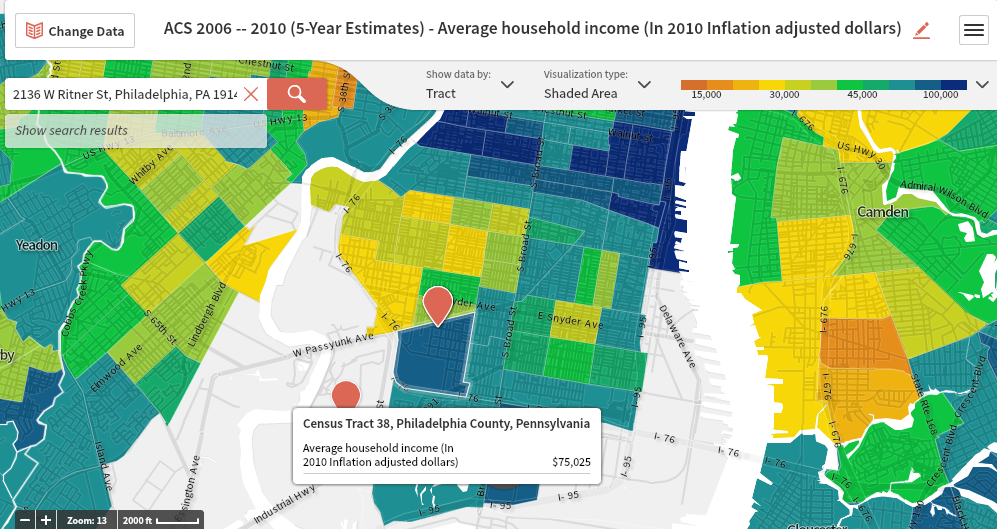
Average Household Income (in 2010 inflation adjusted dollars) for Tract 38: $75,025
Tract 38 in 2000:
A few changes of note:
- Total of 1,654 households.
- 713 households (43.108%) made more than $45,000 annually
- 155 households (9.371%) made more than $100,000 annually
- Average Household Income (in 1999 dollars) was $52,673.
- Median Household Income (in 1999 dollars) was $36,591.
- Total of 1,677 households.
- 1,010 households (60.227%) made more than $45,000 annually
- 346 households (20.632%) made more than $100,000 annually
- Average Household Income (in 2010 dollars) was $75,025.
- Median Household Income (in 2010 dollars) was $52,031.
A few changes of note:
- The number of households making more than $45,000 increased by almost 20%.
- The number of households making more than $100,000 increased twofold.
- Both the average and median household income increase by approximately $20,000 with the median household income in 2010 only slightly below the average household income in 2000.
- Although I'm not entirely sure how inflation plays into these statistics, even if the relative income increase is not as great as it seems, the contrast between Tract 38 and the surrounding tracts further widened in that 10 year period.
Education data
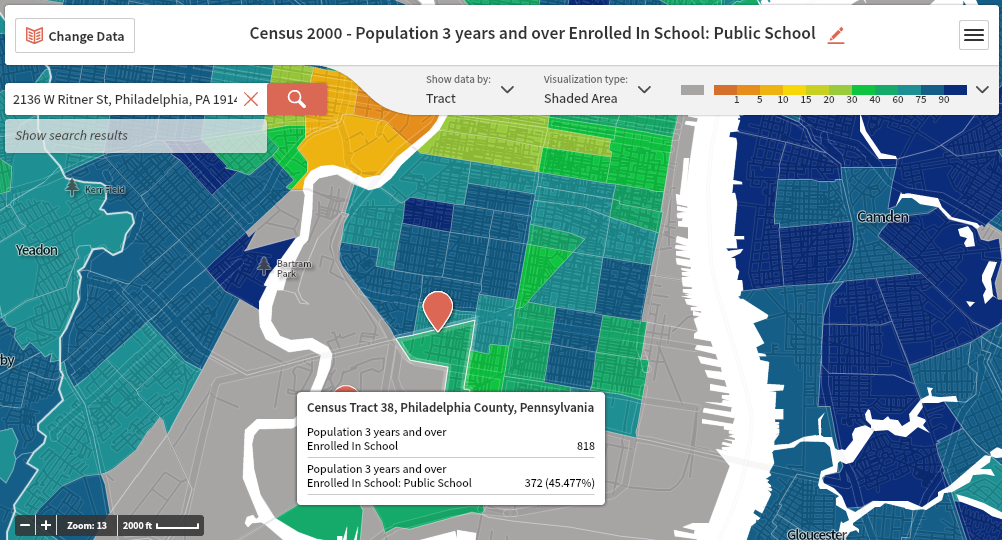
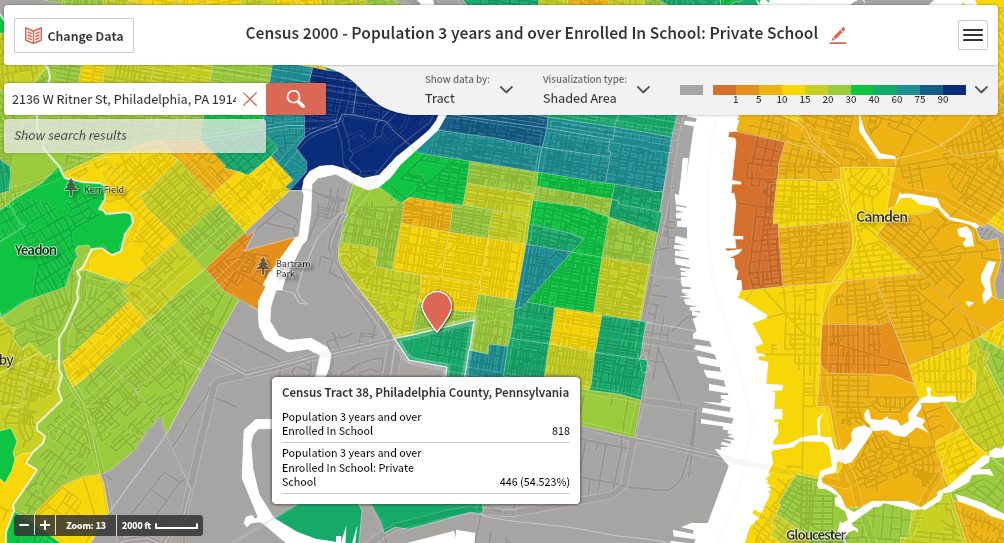
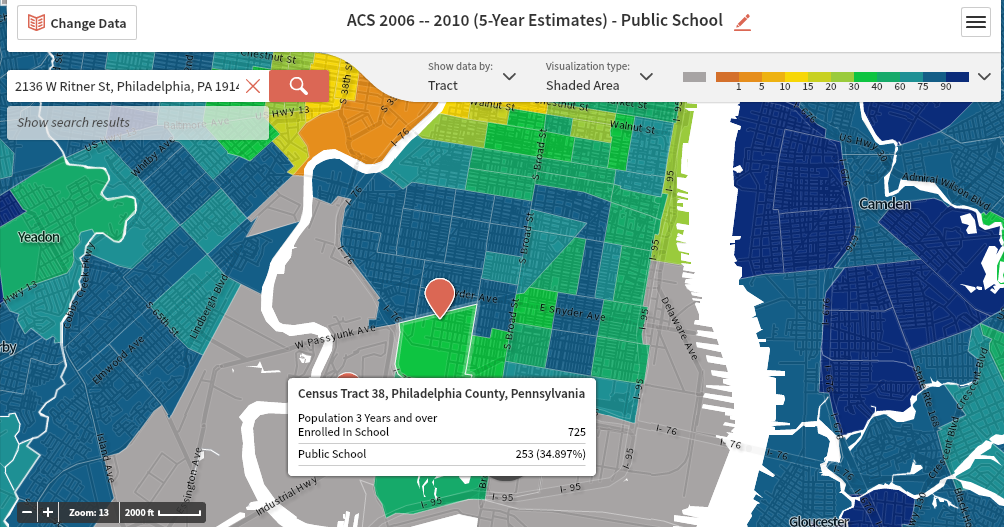
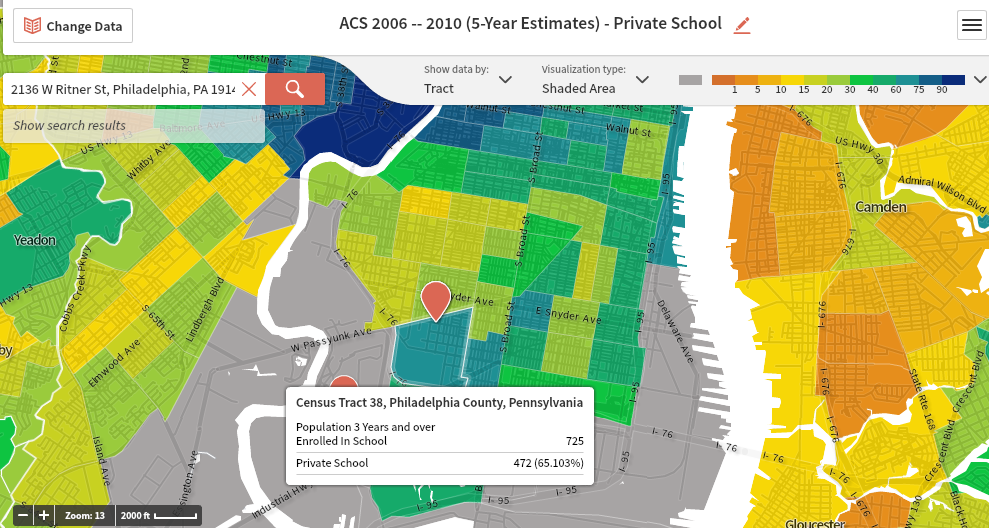
These maps, which are by nature pairs of inverses, show a trend from 2000 to 2010 towards private schools. While in 2000, 45.477% of children within Tract 38 were enrolled in public school and 54.523% were enrolled in private school, by 2010, 34.897% remained in the public schools while 65.103% attended private schools. Interestingly, the overall number of children 3 years and older lowered from 818 to 725, a difference that could mean something, but that doesn't negate the significance of the increase in private school attendance, especially on the relationship between GAMP and its immediate community.
